Buried at the bottom of a recent news release from the Bureau of Labor Statistics was an interesting tidbit that got a lot of attention in Pierce County: From July 2017 to July 2018, Tacoma-Lakewood had the largest over-the-year percentage increase in employment in the nation — 4.9 percent.
That means Tacoma-Lakewood surpassed even the metro area of Seattle-Bellevue-Everett, where employment grew by 3.6 percent over the year.
We decided to dig a little deeper into that data: In July, Tacoma, University Place, and Lakewood each saw a 10-year low in their respective unemployment rates.
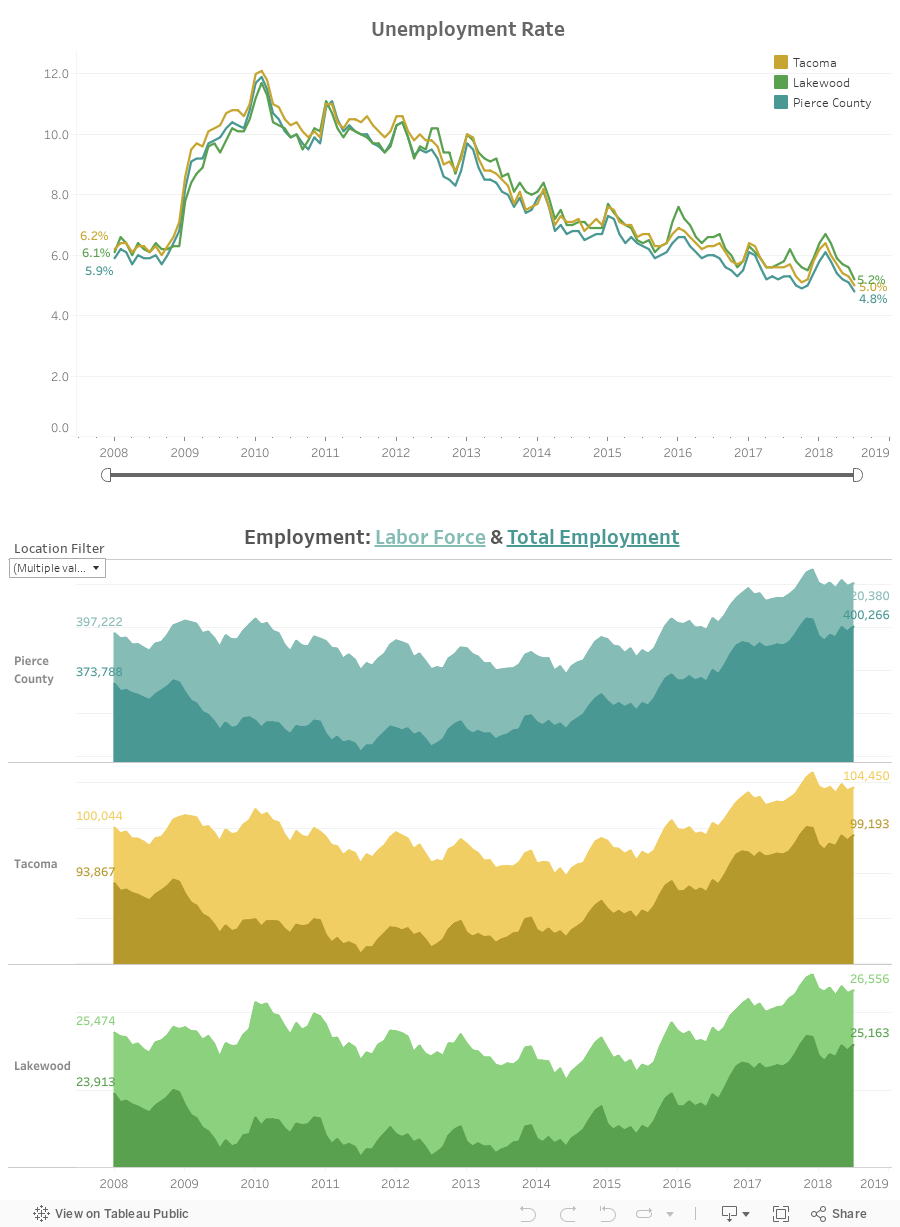
Let’s talk about Tacoma, Lakewood, and Pierce County, since the employment stats for those particular municipalities have been in the news recently. Using the top interactive above, you can see historical data on the unemployment rate in each place stretching back to 2008. Hover over each line at a specific point in time to see the unemployment rate and the number of unemployed folks for each jurisdiction during that month.
On the second tool, you can see historical data for the total labor force (the top line) and the total number of employed individuals for Tacoma, Lakewood and Pierce County. Hover over the top of the light-colored “mountain range” at a point in time to see the total labor force for that month, and hover over the top of the dark-colored “mountain range” to see the number of employed people. That lighter-colored gap between the total labor force and the employed labor force? You guessed it — that gap represents unemployment.
This is a helpful visualization of how dramatic unemployment was during the height of the recession. Prime example: In Tacoma in February 2010, the rate was 12.1 percent.
But lately, we’ve had years of steady employment growth. In July, Pierce County unemployment hit a record low for this year of 4.8 percent. That represents a 60 percent drop from March 2010, when the recession had a stranglehold on the nation and our region, and Pierce County unemployment was at 11.9 percent.
With July’s numbers in, 2018 is shaping up to continue the decline in unemployment.
Note of caution: Even though we continue to see year-over-year declines in unemployment, the improvements are smaller today than they were from 2013 to 2016. When we model the county unemployment rate, our forecast estimates a much more modest year-over-year decline moving forward. This isn’t necessarily a bad thing – a consistently low unemployment rate is always looked upon favorably.
Room for improvement: Despite record low unemployment estimates, there are still more than 20,000 individuals in the Pierce County labor force looking for work, and countless others who are underemployed and earning less than a livable wage.