
Demographic Summary
Economic Trends
Workforce Trends
Population Trends
Since 2010, the population in Pierce County has shown strong growth, adding over 133K new residents for a total population just south of 1M. However, recent data suggest that growth may be slowing or even stalling.
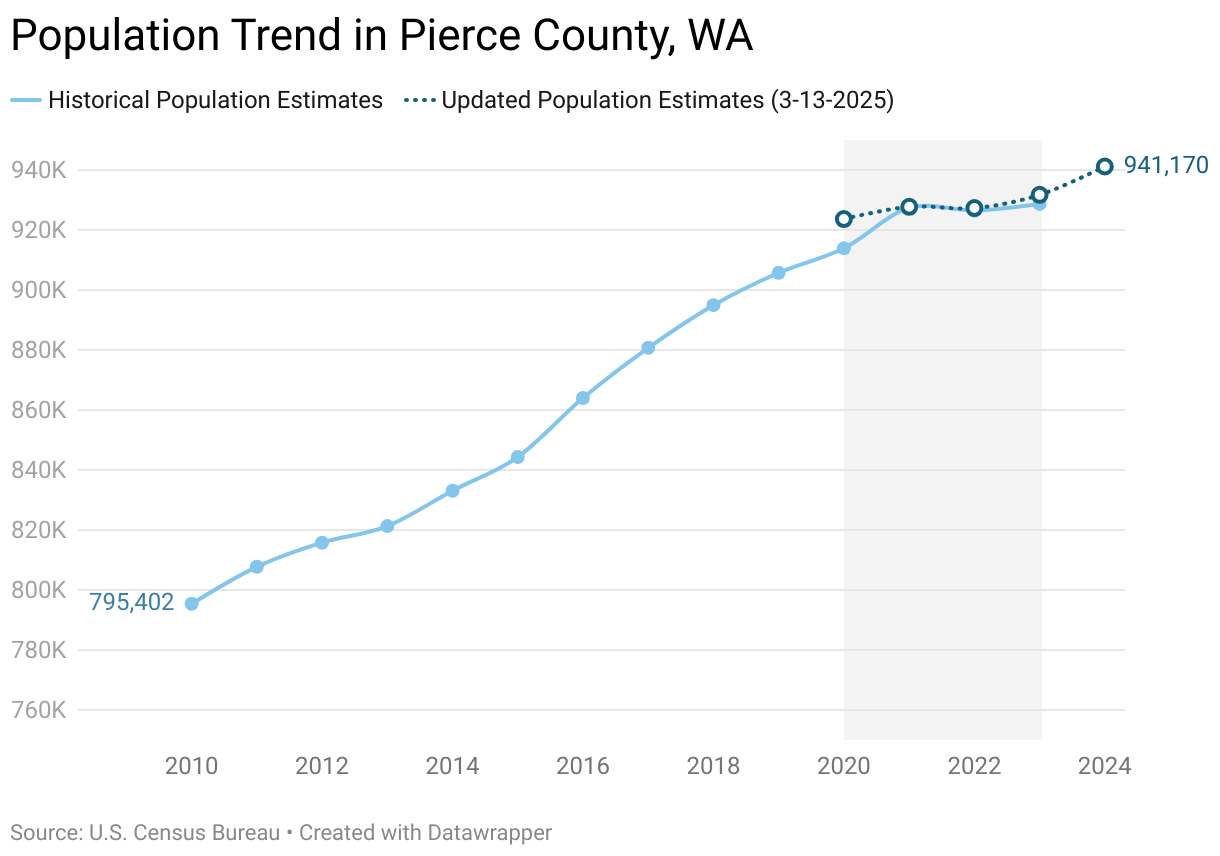
Birth rates, the most popular explanation for population changes, have declined. But from a regional vantage, this doesn’t matter much; total annual births have remained relatively stable, and shifts to the rate are fairly benign. Similarly, the total number of deaths each year has held steady, with only a slight uptick, attributable to an aging population and the impacts of the COVID-19 pandemic.
Migration Patterns
Migration patterns, however, have varied significantly. While international migration has consistently shaped the county’s cultural landscape, domestic migration has historically been our key driver of regional growth. In recent years, domestic migration has declined rapidly, becoming a negative factor in 2021 as more people moved away from Pierce County than to the area.

Because of the decline in domestic migration, we’re at an interesting point where international migration plays a much greater role in our region’s growth than in years past. In 2023, we had 1,846 new immigrants and refugees migrate to Pierce County, representing 83% of our population increase that year. In 2022, this number was 2,316, and without immigrants and refugees, Pierce would have seen a population decline that year. We anticipate this trend will continue, but the capacity in the local support networks that help new arrivals resettle is less certain.
This decline in domestic migration, if persistent, may strain long-term economic growth, but it also highlights the value of our international residents and their role in our region’s future growth. Our ability to maintain a balanced and thriving economy could depend on the county’s capacity to attract and retain residents through enhanced economic opportunities (particularly for families with children), increased housing development, and quality-of-life initiatives.
Demographic Shifts

Pierce County has added 133K residents since 2010 (▲17%). We’re encouraged to see some of the strongest growth among working aged adults between 25-34 (▲27%) and 35-44 (▲28%). However, we’re also seeing indications that our population is getting older, with about 40% of that total growth concentrated among residents 65 years and older (▲61% from their 2010 population). At the top end of the distribution, we see less growth among residents under 25 (▲5%). This shift has driven our median age up 1.6 years to 37.5.
Pierce County is also becoming a more diverse community, led by growth among residents of more than one race (▲191%), followed by Some Other Race (▲79%) and Asian (▲41%). Hispanic and Latine residents have contributed to over a third of the total population growth (▲66% from their 2010 population).
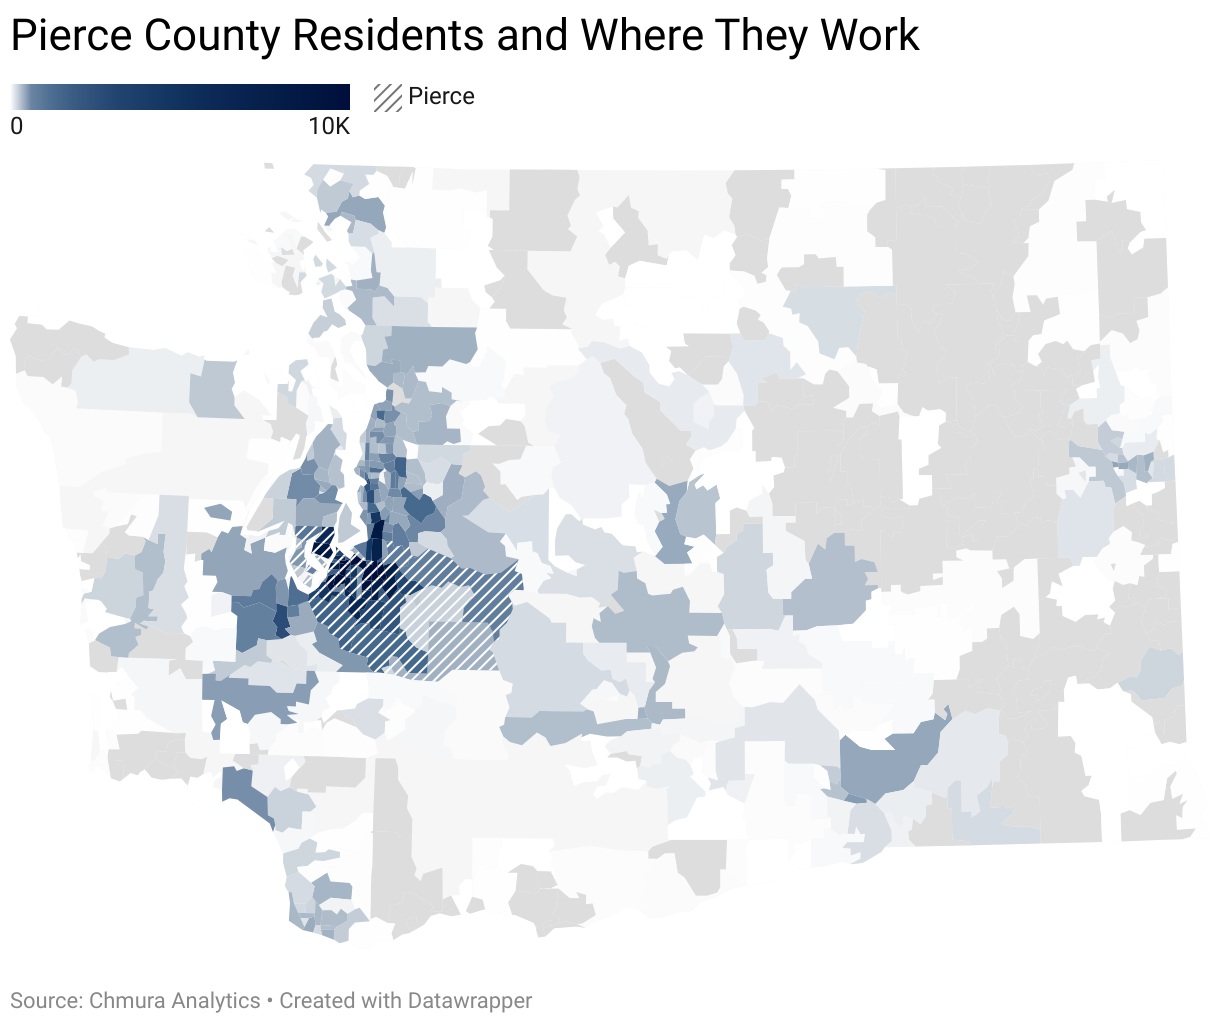
Pierce County Residents & Where They Work
Note on our commuting data and why our estimates differ from others

There are a couple of ways to estimate labor shed and commuter trends. The most common approach is using Longitudinal Employer-Household Dynamics Origin-Destination Employment Statistics (LODES) data which gives some eye-popping estimates for Pierce County.
That source alone suggests that the majority of Pierce County residents (51%) work outside of the county and that 40% of our workforce is commuting in from out of the region. These results are less reliable, as LODES data tends to differ more significantly at smaller geographic levels from other sources, such as population data collected via the American Community Survey (ACS).
This is because LODES employment location estimates are reported by the employers. In many cases, this is not the location where the employee performs his/her work duties — this is especially problematic with remote work and employers reporting for multiple worksites.
For our geographic level, we instead rely on a combination of data from both LODES and ACS commuting and workplace samples. For more information, consider reading Design Comparisons of LODES and ACS Commuting Data Products.

Pierce County continues to experience a high volume of outbound commuters, with 113K residents traveling to neighboring counties for work. However, this is still about 5K fewer than pre-pandemic levels — a drop most likely attributable to employer shifts to allow more work from home. With recent back-to-office announcements from large employers like Amazon, we anticipate this will likely increase.
1 out of every 4 Pierce County residents work outside of the county.
The largest share of outbound commuters (73.7%) head to King County, followed by Snohomish (6.04%), Thurston (7.09%), and Kitsap (3.16%). In contrast, 47,757 workers — a smaller but still sizable workforce — commute into Pierce County, with the highest inflow from King County (38.86%), followed by Thurston (22.8%), Snohomish (11.67%), and Kitsap (6.55%).
1 out of every 7 Pierce County workers commute from outside the county.
When we look at detailed commuter destinations for Pierce County residents, we see a wide geographic spread with employment connections to both rural and other metropolitan areas throughout the state. These commuting trends highlight Pierce County’s strong connections with surrounding regions and economic ties, as well as its reliance on neighboring areas for employment opportunities and our available labor supply primed for local economic development.
Within Pierce County, we’ve seen seismic shifts in employment, with the strongest growth along transportation corridors (i.e. along the West Valley Highway, Puyallup River, and Nalley Valley) and in more rural regions of the County (Sumner, Frederickson, and Dupont). JBLM has seen a reduction in stationed military members, representing one our largest geographic contractions since 2010 (-1,300).

Wages & Inflation
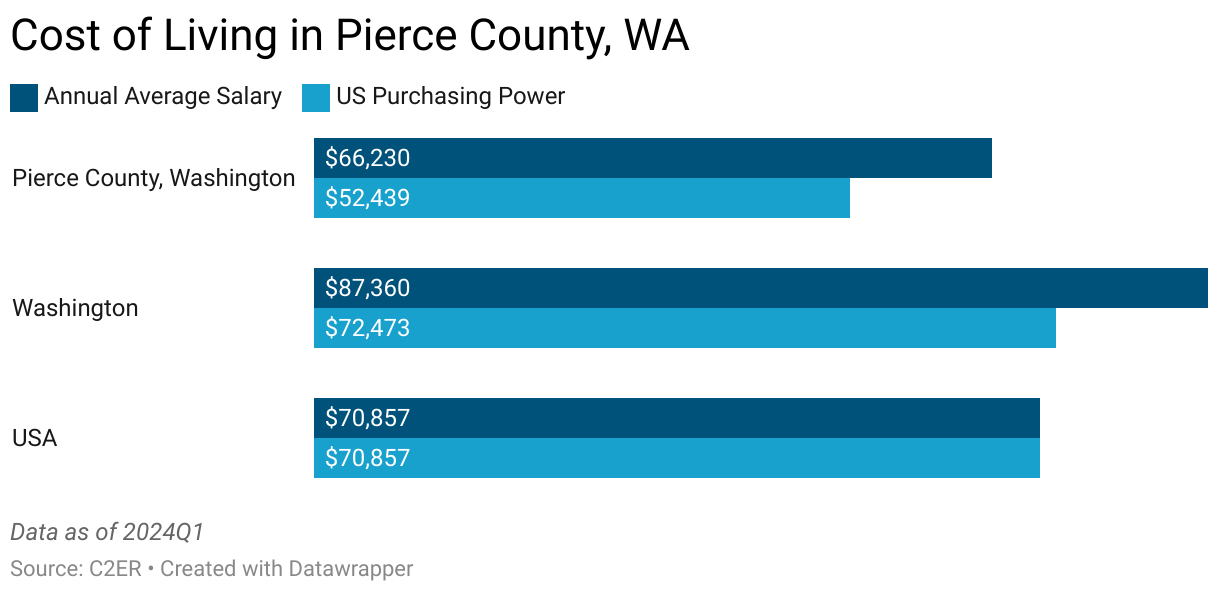
While the average annual wages in Pierce County have increased significantly, the rate of growth has not kept pace with the average wage in Washington state. Over the same time, inflation has driven our regional cost of living up faster than other areas.

As of December, total inflation for our area was down to 2.7% — that is, the price of goods and services is, on average, about 3% higher than it was one year ago.
However, this varies significantly across expenses, with some items like medical care dropping rapidly, and others, such as eggs and coffee continuing to rise.
Year-over increases in housing costs were down to 4.4% in December, just 1.7 points higher than the overall inflation rate. But this comparison ignores the fact that housing is a dominant driver of overall inflation and that if we were to remove shelter from our total measure, our inflation rate would drop to just 1.5%. This is a critical issue for our area as affordability impacts so much of our economy, including the value of dollars earned and spent regionally.
Because of the higher regional cost of living—currently 26% higher than the national average—the relative value of a dollar in Pierce County is much lower than the national average. This means that the average purchasing power for Pierce County Residents is about $20K less than the statewide average and $18K less than the national average. Put another way, Pierce County residents are earning less and spending more on basic expenses than the average Washingtonian.
Separately, the stagnation in population growth and high cost of living may be our region’s greatest long-term economic risk. However, the two challenges together may prove to be the ideal pair. From a macroeconomic lens, our high commuting population represents a labor surplus, but without sustained population growth, regional establishments will have to pay more to compete with employers in King & Thurston County for these workers. From a labor standpoint, increased wages to recapture some of that lost labor would mean less indirect commuting costs and relatively higher purchasing power for workers. Population growth since the Great Recession has outpaced growth in our housing inventory. A period with a static population represents an opportunity for housing development to close in on that gap and reduce the relative cost of housing, the primary driver of regional inflation.
Another silver lining in this scenario is that higher wages and a lower cost of living should help spur domestic migration to the area, potentially kick-starting another cycle of, ideally, more balanced growth.
Employment Trends
The unemployment rate is near a historical low, 5.4% as of December, representing about 23.6K workers. However, at 418K workers, Pierce County’s total employment is still well below our pre-pandemic high. As interest rates decline, we expect to see more investment in labor from our local establishments and, with some luck, a return to growth.

The unemployment rate, unfortunately, underestimates the full share of job seekers. The Bureau of Labor Statistics estimates several alternative unemployment measures to correct for this, with the most robust measure known as the U-6 Unemployment Rate. This approach is more comprehensive as it also includes:
- Marginally attached workers (people who aren’t working or job hunting but want a job and have looked in the past year)
- Discouraged workers (A subset of marginally attached, including those who have stopped job hunting because they think no jobs are available)
- Part-time workers for economic reasons (people who want full-time work but can only find part-time jobs)
In Washington, the most granular level where these estimates are reported, the U-6 unemployment rate for the fourth quarter of 2024 was 9.0%. However, even this alternative measure is likely an underestimate as there are many settings where individuals are not included in data samples but may still be looking for employment to motivate or in anticipation of a change in their circumstance (e.g. unsheltered individuals, student housing, correctional facilities, military barracks).

Another way of considering labor force participation is to measure the share of all individuals who are not in employment, education, or training (NEET). In Pierce County, 1 out of every 5 residents between 16 and 64 fall into this category. While it’s tempting to infer that we have an outsized share of residents who were able to comfortably retire early or stay home to raise young children, the data don’t support these simplifications: among the 120K NEETs, 63% have an income-to poverty-ratio below 200% of the federal poverty level, qualifying them for basic food assistance. And just 5.5% of those 120K NEETs have a child under 5 years of age. This issue is most apparent when we look at those between 16 and 64, also called disconnected young adults, where 1 out of 8 are not connected to employment, education, or training. While the share of NEETs has declined since 2013 (▼3.6% overall), it’s virtually unchanged for these young adults.
Establishment Trends
As of 2023, Pierce County had 18,689 employer establishments representing nearly 344K workers. The majority of these establishments (55%) are micro-businesses with fewer than 5 employees. This group of establishments is especially prone to change and volatility each year as new businesses are emerging to compete for market share, many expand and achieve more stability, while others contract or permanently close shop.

2023 was no exception and we saw a significant decline among micro-businesses (▼43%). But because these establishments only represent 6% of workers, and because of gains among the larger establishments, the total number of workers actually increased that year. This shift represents a post-pandemic consolidation of micro-businesses and a return to an employer landscape more like 2018 than any year since.

Economic Equity
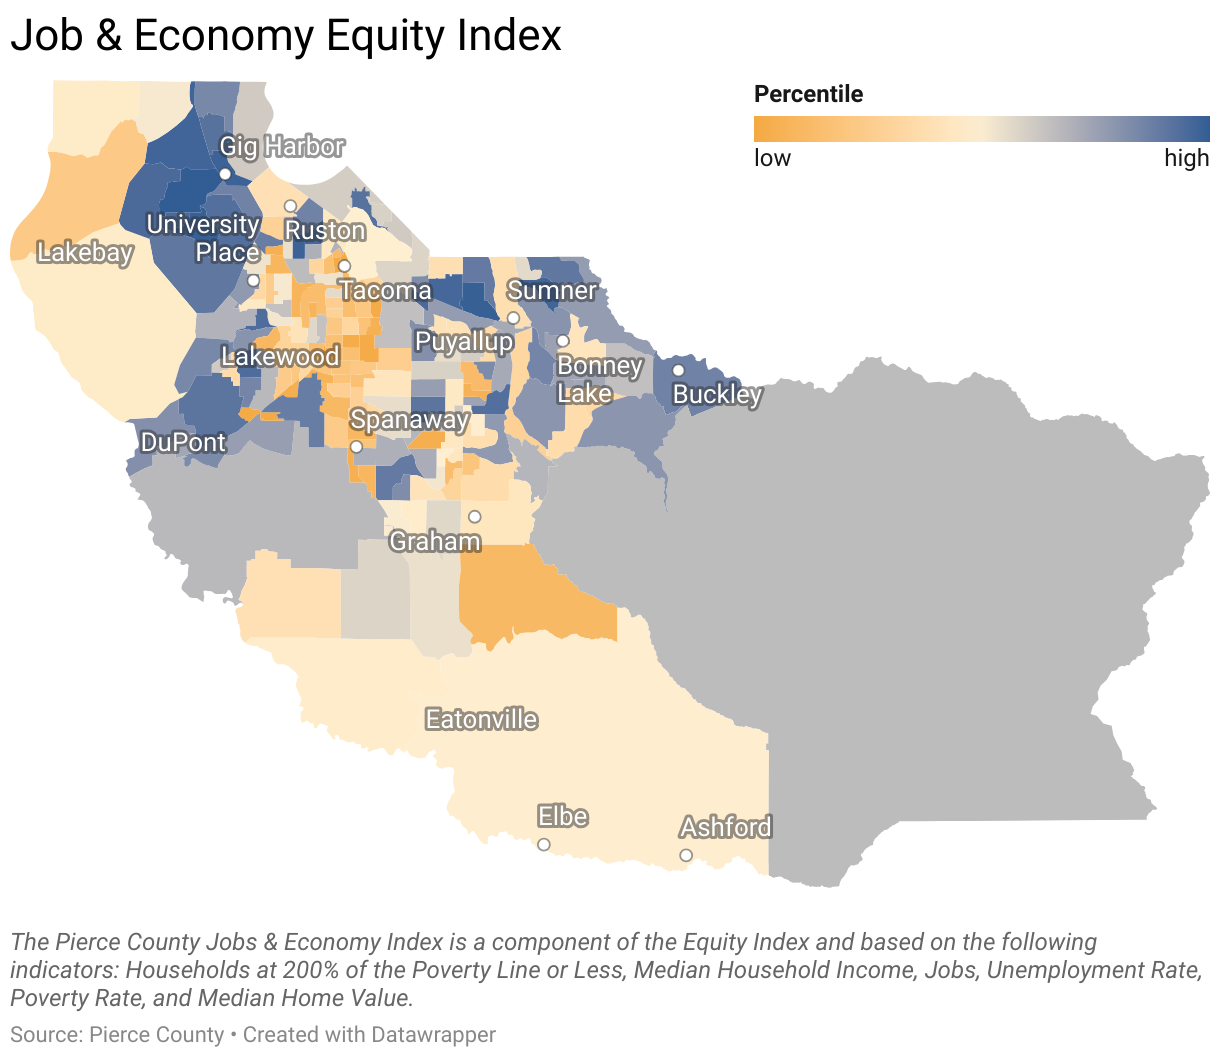
Take a road trip across the county, and you will see stark indicators of economic prosperity in some areas and signs of hardship in others. This geographic economic inequity is substantial and driven by many factors, including unemployment, poverty, the availability of high-quality jobs, income, and home value.
Pierce County’s Equity Map highlights differences in these factors through the Economic Index. In particular, the Hilltop, Eastside, South Tacoma, and Nalley Valley neighborhoods stand out as areas with higher population density and especially low levels of economic equity. Further south, this trend continues into Parkland and Spanaway. While water-adjacent regions boarding the Puget Sound are almost universally more prosperous, the west peninsula (including Lakebay) stands out as an exception to this rule, in large part due to the lack of available high-quality jobs and higher rates of poverty.
ALICE Households

The number of households below the federal poverty level declined slightly in 2022 to just over 27K. However, the federal poverty measure, now over 60 years old and mostly unchanged, is based on assumptions and data that no longer reflect the complicated realities of our economy. Because of this, it’s important that we also consider households earning above the poverty rate, but still unable to afford the basics. These families, known as ALICE (Asset Limited, Income Constrained, Employed), represent one in four households in Pierce County, WA (over 90K). Since 2019, over 25K families have fallen into this category, earning enough to keep them out of poverty but not enough to make ends meet.
Industry Snapshot
In Pierce County, nearly 1 out of every 5 workers are employed in the Health Care and Social Assistance industries (64,639). These industries, along with the next four largest—Retail Trade (38,818), Education Services (31,306), Accommodation & Food Services (30,144), Construction (26,893) — represent more than half of all workers in the region.
Over the next 5 years, we expect to see over 11,000 additional jobs added to our regional workforce, with 11% of this growth attributable to Disability and Elderly Service Providers (1,287).
We also anticipate strong growth among General Medical and Surgical Hospitals and Offices of Physicians, which together will account for an additional 1,032 workers. Other Individual and Family Services, representing establishments that provide general individual and family social assistance services, is another industry where we expect to see significant growth over the next 5 years. This industry is largely made up of Social and Human Service Assistants, Substance Abuse and Behavioral Disorder, Mental Health Counselors, and Child, Family, and School Social Workers (i.e. essential mental, social and behavioral health professionals).
The only industry that is forecasted to noticeably contract is Elementary and Secondary Schools (-265 over 5 years), a relatively small shift representing just 1% of that industry and driven in large part by demographic shifts and declines in student enrollment. Paradoxically, and partly because this industry also has a high share of older workers who are expected to drive a large wave of retirements, Elementary and Secondary Schools is expected to be the top industry by total demand for workers over the next 5 years (10,977).


Occupation Snapshot
The total number of workers in Pierce County has increased by nearly 20,000 over the past five years. While this rate of growth is expected to slow, over the next five years, we still expect to see 200K job openings, that is, Total Forecasted Demand. These employment opportunities are largely driven by workers changing jobs (55% transfers) and workers leaving the labor force (39% separations).
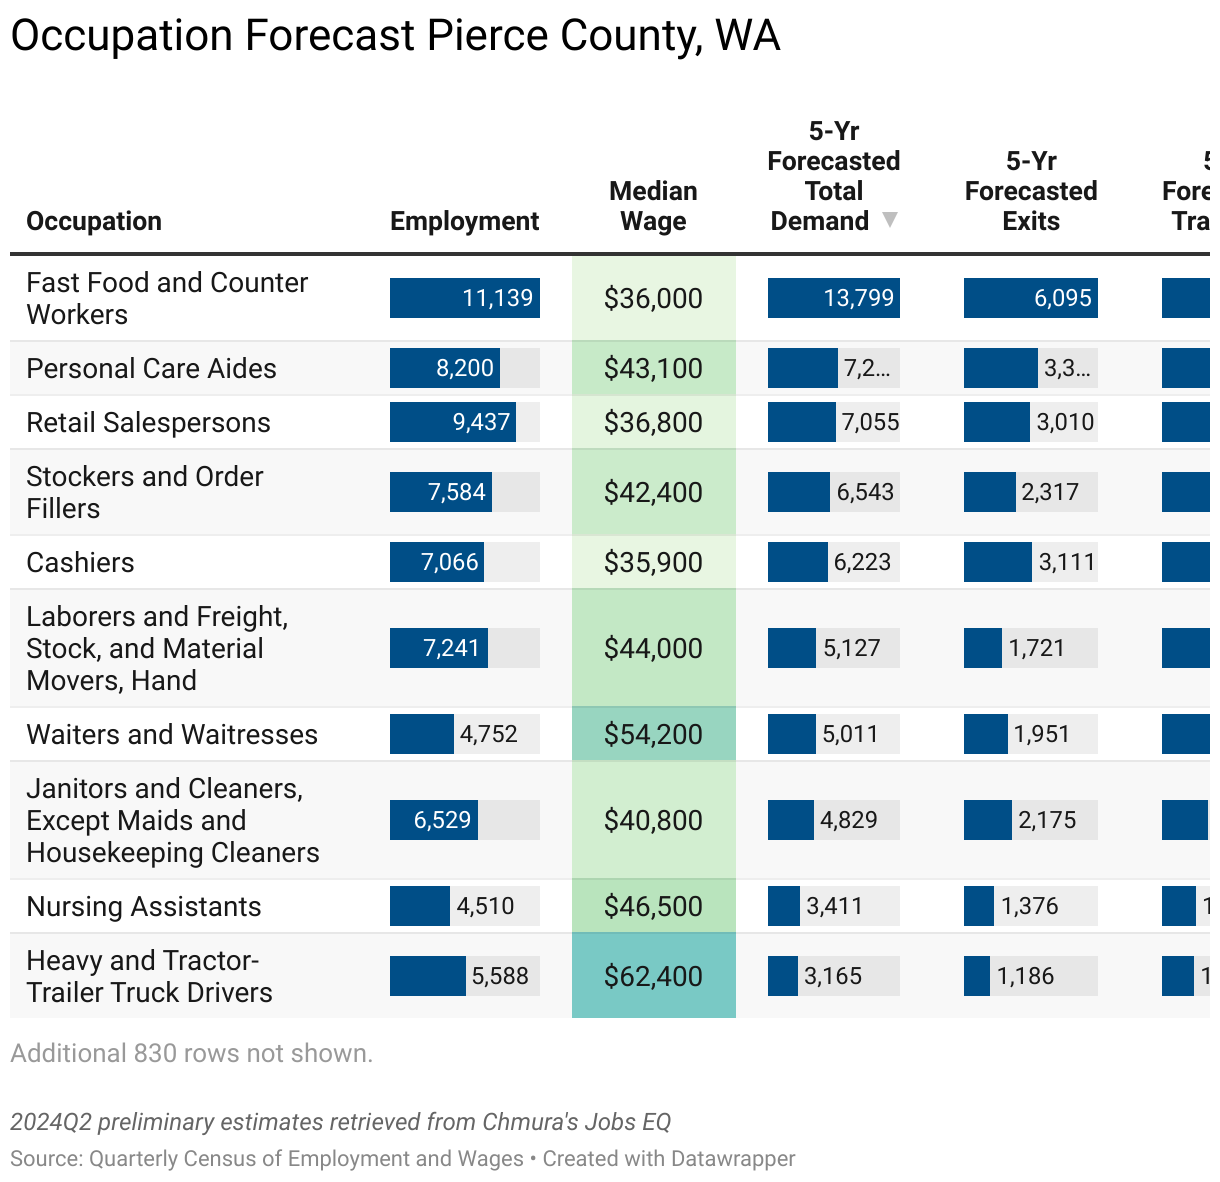
The third component of demand, net growth, reflects the anticipated change in the total number of workers in an occupation, such as an employer creating new positions as part of an expansion or cutting positions in a contraction. Regionally, we expect the workforce to pick up another 11,000 employments. While often much smaller than transfers and separations, growth is an important component of workforce development and an indicator of emerging demand.
Overall, we continue to see the strongest total demand for entry-level service work (Fast Food, Personal Care, Retail, Warehousing, etc.). While the wages for many of these positions are below what many residents need to achieve self-sufficiency, they still have economic value and are important recruitment sources for employers and opportunities for workers to establish experience and develop professional skills.
Employers should consider these highdemand, low-wage positions in their development of internal and sectoral career pathways for two reasons: established pathways with clear opportunities for growth will help entice workers to these entry-level positions, and they will formalize a labor pipeline for more permanent, self-sufficient careers, ensuring a quick, vetted, and predictable supply of talent to meet future labor needs.
Select Occupations Expecting Above-Average Growth and Wages
These occupations are expected to represent over 1,700 new jobs over the next five years, one-seventh of all new jobs in Pierce County.
| GROUP | OCCUPATION | 5-YR GROWTH | MEDIAN WAGES |
|---|---|---|---|
| Healthcare | Nurse Practitioners | 157 | $139.6K |
| Registered Nurses | 336 | $105.4K | |
| Medical Assistants | 191 | $56.1K | |
| Dental Assistants | 70 | $56.0K | |
| Trades | Electricians | 116 | $90.4K |
| HVAC Mechanics and Installers | 61 | $73.5K | |
| Construction Laborers | 119 | $57.3K | |
| Analysts | Market Research Analysts & Marketing Specialists | 72 | $96.3K |
| Management Analysts | 115 | $116.5K | |
| Data Scientists | 45 | $128.2K | |
| Management | Project Management Specialists | 74 | $118.6K |
| First-Line Supervisors of Construction Trades | 97 | $104.9K | |
| Financial Managers | 84 | $166.6K | |
| Construction Managers | 63 | $128.4K | |
| Medical and Health Service Managers | 144 | $133.9K |
Green Economy
We anticipate the rise of the Green Economy to continue, sustained by the long-term investment impacts of the Inflation Reduction Act, continued consumer demand for more sustainable economic solutions, state-level priorities, and inclusion of the green economy in every municipal comprehensive and climate plan in the county.
First, let us define the Green Economy: Here we take the same holistic approach detailed by the authors of Tacoma’s Green Economic Development Strategy, which state that “the Green Economy encompasses businesses making green products or services, using green processes, and businesses that might do either if the right incentives, expertise, and workers were available. It can also be defined by the workers that make green products or services, or that implement green processes, or that would be involved in this work if more businesses entered the green economy (i.e., workers that would need to be hired or retrained). In some cases, these definitions overlap – a worker at a business creating a green product whose day to day work involves green tasks (defined below). But that is only a fraction of the green economy. There are also businesses making green products that employ many workers whose tasks are not green (e.g., an accountant at a solar company), and many workers whose tasks are green but whose businesses do not create what is typically viewed as a green product (e.g., a logistics manager making trucking operations more fuel-efficient).”
Adjusting for the concentration of green tasks in an occupation (activities classified as a carbon-mitigating) in Pierce County, we can clearly see that most workers are engaged in some green activities.
Top Ten Occupations with a High Concentration of Green Tasks
| 6-Digit SOC | Occupation Title | 8-Digit 0*Net Taxonomy | Employment |
|---|---|---|---|
| 53-7062 | Laborers and Freight, Stock, and Material Movers, Hand | Recycling and Reclamation Workers | 7,228 |
| 53-3032 | Heavy and Tractor-Trailer Truck Drivers | 5,612 | |
| 11-1021 | General and Operations Managers | 5,473 | |
| 47-2061 | Construction Laborers | 3,750 | |
| 49-9071 | Maintenance and Repair Workers, General | 3,336 | |
| 37-3011 | Landscaping and Groundskeeping Workers | 2,690 | |
| 47-1011 | First-Line Supervisors of Construction Trades and Extraction Workers | Solar Energy Installation Managers | 2,328 |
| 47-2111 | Electricians | 1,726 | |
| 47-2152 | Plumbers, Pipefitters, and Steamfitters | Solar Thermal Installers and Technicians | 1,201 |
| 49-9021 | Heating, Air Conditioning, and Refrigeration Mechanics and Installers | 1,012 |
Source: 2024 Q3 Quarterly Census of Employment and Wages
Note, because of taxonomy differences and the level at which employment statistics are collected, some occupations here represent many workers not engaged in a high concentration of green tasks – e.g. Solar Thermal Installers and Technicians only represent a small share of all Plumbers, Pipefitters, and Steamfitters which have a lower share of green tasks overall.
However, growth in this sector is difficult to quantify, largely because whether an occupation or industry is green or not has more to do with the context of the work than the official classifications. Pipefitters, for example, can be found working in many settings, including hydro-electric plants and methane distribution. Similarly, a commercial construction establishment is likely much greener when working on a high-efficiency project than, say, a concrete parking garage.
This challenge is also why demand for this sector has so much potential. Moving beyond the traditional notion of green jobs (e.g. solar photovoltaic installers and sustainability officers), we’re beginning to see demand for green skills present in a much broader span of the economy. These include everything from green trade skills (e.g. electric vehicle maintenance and electrification, heat-pump installation, water sanitation and testing) to administrative and management responsibilities (e.g. carbon accounting, climate risk and action planning, and sustainable procurement) and, of course, digital skills needed in just about every sector to support systems automation and improved efficiency. Establishments are also seeing demand for more sustainable practices from customers, regulators, and public sector clients, leading to incremental but wide-ranging shifts in their work context, which is helping drive the emerging demand for workers with the necessary skills. However, it’s critical that these green transitions take place with intentionality and focus on addressing the occupation segregation and inequity inherently present in this sector. Authors of Tacoma’s Green Economic Development Strategy found that these jobs, regionally, are more concentrated among men (82.5%) and disproportionately among White, Non-Hispanic men (58.8%).
AI & Automation
Traditional, repetitive automation, though far less exciting than AI (Artificial Intelligence), continues to spur productivity advances. Automation and workflow tools have been around for years, but the increased connectivity across applications and the ability to write more complex workflows have greatly extended their accessibility and relevance, especially for smaller employers.
Even very small establishments are increasingly able to leverage automation to consistently process information and complete tasks that were otherwise left to humans or not done at all because of a lack of capacity. We expect the impact of traditional automation to continue bolstering productivity with growth mirroring increases in access and applicability.
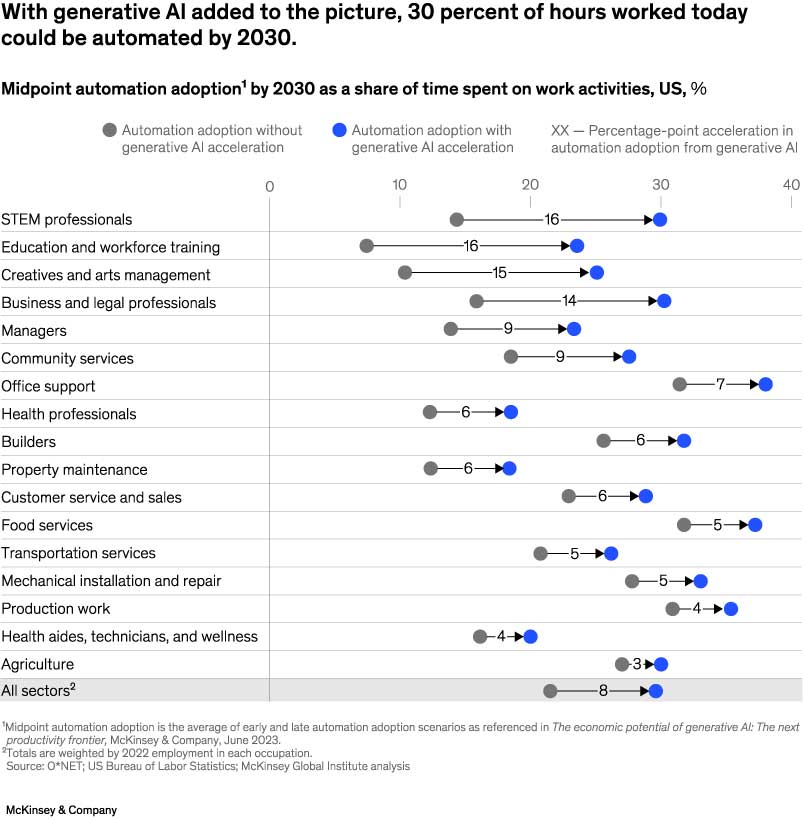
Artificial intelligence is another area where we anticipate continued economic influence. The ability to analyze large datasets with speed and accuracy creates new opportunities in every sector. Most obvious are the opportunities to scale processes that rely upon predictive analytics and increasingly complex automation. The practical emergence of large language models (LLM) both bolsters these traditional use cases and expands the potential for applications in other settings. Though, the exact speed and scope of this influence is hazy. In fact, nearly all predictions about the timeline and the extent of AI adoption are vague, with the only exception we identified coming from a McKinsey report (Ellingrud et al. 2023) that estimated AI adoption could replace up to 30% of labor hours by 2030.
With such imprecision from the leading prognosticators, planning for this inevitability can feel like a Sisyphean task. One ray of light from a MIT-IBM working paper (Svanberg et al. 2023) adds consideration to the technical feasibility and cost-effectiveness of building out systems and implementing AI solutions. Their conclusion is that “AI job displacement will be substantial but also gradual,” leaving some room for regulatory policy and retraining to mitigate the impact to workers.
Just like the unknowns with AI adoption and scope, it’s difficult to fully appreciate the negative effects of AI. In the near term, we expect to continue wrestling the more prominent issues, such as:
- Job Displacement: Unlike traditional automation, AI can automate tasks that were once hallmarks of human skill, such as content creation and inferential reasoning, with the flexibility to work in just about any context. This is especially true with the emergence of virtual agents, which have even fewer restrictions and are marketed as AI workers “for hire”, furthering the risk of displacement across nearly every sector.
- Algorithmic Bias and Lack of Transparency: AI systems trained on biased data can perpetuate existing prejudices and lead to discriminatory outcomes in areas like hiring, loan approvals, and criminal justice. The lack of transparency in the decision-making process within complex algorithms is another critical issue, often making it impossible to fully understand how certain conclusions are reached.
- Privacy concerns: Extensive data collection by AI systems raises privacy issues, especially when personal information is used without proper consent. The issue of privacy, and more broadly, trust with AI solutions, presents a challenge in application, as some of the most compelling use cases would require access to sensitive information.
- Misinformation: And, of course, AI can be used to create deceptive content with increasingly realistic results across many mediums, facilitating the spread of misinformation and manipulation and eroding trust in traditional digital content.
- Power Consumption and Carbon Footprint: Increasingly relevant is the unfortunate fact that these algorithms require large amounts of power. With increased adoption and larger more complex models, this will likely only continue to grow. The risk is that the Pacific Northwest power grid could be pushed beyond its capacity to meet the demand from data centers used to power AIs. The Northwest Power and Conservation Council draws attention to this issue and forecasts that regional data centers will require 7% more energy every year for the next 20 years, a rate of growth currently unsupported by planned growth from renewable energy sources.

Not surprisingly, many of these challenges are helping temper the rate of adoption, creating a narrow window for establishments and workers to adapt to a shifting landscape. As we consider demand for these emerging opportunities, it’s important that we acknowledge the populations who are most represented in these jobs.
As we have seen in other emergent technology occupations, Asian and White, Non-Hispanic Men have benefited the most from these transitions to date. Black, Latine, and Female workers, in particular, are much less represented in these occupations, and without intentional engagement to ensure a just economic transition, they risk further exclusion from emergent opportunities in the information sector.
Wage Gap

Wages in Pierce County have continued to climb, but the compensation gap between men and women remains persistent. As of 2023, the median wage for men was nearly $14K more than for women. This gap varies by race and ethnicity, with the gap between White, Not-Hispanic men and Hispanic women jumping to over $28K. And, despite the clear earning gains associated with higher education, the gap is greatest among college graduates. This is not because higher education increases inequity in compensation — most occupation groups that require a higher education have a relatively low wage gap. Rather, we see that it’s the sorting of men and women into different professions and differences in compensation between occupations. For example, men represent the vast majority of computer, engineering, and science workers, where the total median wage is $101K, while most healthcare support workers are women, where the total median wage is just $41K.
Our tendency to associate some occupations as more suitable for men or women is problematic for many reasons, most especially because our economy values (and compensates) some labor and skills more highly than others. However, to make meaningful progress in closing the wage gap, both employers and training providers need to be aware of how these trends, and specifically how our role in the training/employment pipelines, actively perpetuate wage inequity.