
FOR IMMEDIATE RELEASE
CONTACT: CANDICE RUUD, 253.213.2960
TACOMA, Wash. – 2018 saw another year of solid growth for Pierce County’s economy: Our unemployment rate hovered consistently below 5 percent for the second half of the year. We gained thousands of nonfarm payroll jobs, and saw higher wages.
Healthcare and social assistance — Pierce County’s largest industry sector — continued to grow. Our region saw huge demand for registered nurses, and thousands of job ads were posted by healthcare employers last year.
Here’s a look at the economic overview for Pierce County, which includes information like the county’s demographic profile, employment and wage trends, cost of living index, industry and occupation snapshots, education levels and gross domestic product.
If you want to read the whole report, you can find it here. Otherwise, we’ve pulled out some interesting highlights we found while looking over the data:
Who works here? How much money do they make? How educated are they?
Pierce County’s civilian labor force is 431,506 strong, according to recent preliminary Monthly Employment Report data. The average annual wage in Pierce County is $49,996, and 25.3 percent of residents aged 25 to 64 have a bachelor’s degree or higher, compared to 31.8 percent nationwide.
All employment in Pierce County is expected to grow 1.2 percent over the next 10 years, but jobs that typically require a postgraduate degree are expected to grow the most of any category, at 1.8 percent per year. Jobs requiring a bachelor’s degree are forecast to grow 1.4 percent annually, and those requiring a two-year degree or certificate are expected to grow 1.5 percent per year.
Digging deeper into education levels, we found the earnings gap between men and women at each level of education is striking.
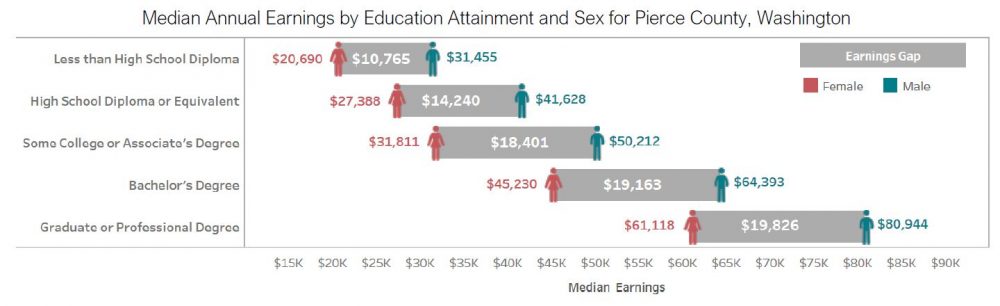
Median earnings show significant jumps in pay as a person earns higher degrees, with an average median increase of more than $10,000 for each additional level of education.
The effect by gender is notable, if not surprising — women are earning less than men even when they have more education. For example: In Pierce County, a woman with some college or an associate’s degree can expect to make roughly the same as a man with less than a high school diploma. A man with some college or an associate’s degree can expect to make more than a woman with a bachelor’s degree.
How does our commute stack up?
Only about 3.3 percent of Pierce County residents commute via public transportation, compared to 6.2 percent statewide and 5.1 percent nationwide. And Pierce County residents’ average commute time is 30.5 minutes (one way), above the statewide and nationwide average — 26.7 minutes and 26.1 minutes, respectively.
Are wages growing in Pierce County?
The average worker in Pierce County earned annual wages of $49,996 as of the third quarter in 2018 — and yes, we are seeing some wage growth, though it’s more modest than what Washington state and the nation are experiencing: Average annual wages per worker grew by 3.7 percent over the preceding four quarters. Statewide wages grew 6.4 percent in that time, and nationwide wages grew 4.3 percent.
This upward trajectory is likely being impacted in part by an escalating minimum wage Washington state voters approved in 2016 that is set to increase each year until it hits $13.50/hour in 2020.
Tacoma also has a voter-approved phased-in minimum wage that bumped up to $12.35/hour on Jan. 1 and will be adjusted annually by the rate of inflation in subsequent years.
How many people work here? How many are unemployed?
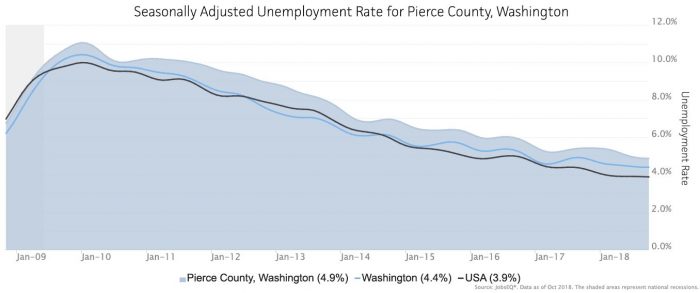
Over the year ending in the third quarter of 2018, employment increased 4.4 percent in the region. And total employment as of the same quarter was 330,219, based on a four-quarter moving average.
The preliminary unemployment rate for Pierce County was 4.9 percent in November, the most recent month for which data is available. That’s 1.4 percentage points above the national rate of 3.5 percent, and half a point above Washington’s rate of 4.4 percent.
Our unemployment rate has declined healthily over the past several years, but has been seesawing in the mid-to-high 4-percent range for the latter half of 2018 as more people are added to the labor force.
How does our cost of living compare?
The cost of living index estimates the relative price levels for consumer goods and services. When applied to wages and salaries, the result is a measure of relative purchasing power.
Our cost of living in Pierce County is 11.9 percent higher than the U.S. as a whole — that means our average annual salary of $49,996 feels more like $44,679.
Statewide, the Washington cost of living index is 27.4 percent higher than the nationwide index. That means the statewide average annual salary of $63,854 equates to just $50,110 in purchasing power.
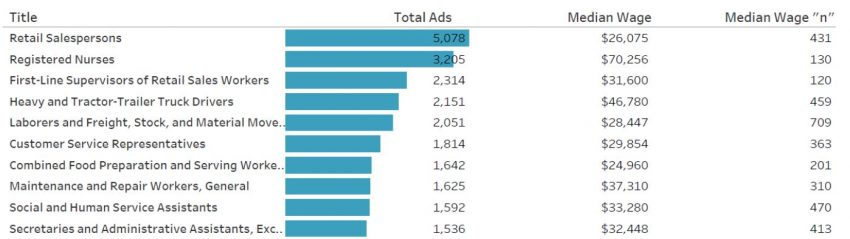
What jobs are in high demand?
More than 80,000 jobs were posted in Pierce County in 2018. The highest demand across the year was for retail salespersons, with more than 5,000 job active job postings in 2018 and a median wage of $26,075.
2nd place: registered nurses, with 3,205 job ads posted last year and a median wage of $70,256.
3rd place: first-line supervisors of retail sales workers, which saw 2,314 job listings posted last year with a median wage of $31,600.
In the coming year, the fastest growing occupation group is expected to be healthcare support occupations with a 2.3 percent year-over-year growth rate. The strongest forecast by number of jobs is projected to be for healthcare practitioners and technical occupations (up 373 jobs) followed by food preparation and serving-related occupations (up 359 jobs).
What are the biggest industries in Pierce County?
As we mentioned earlier, the largest industry sector in Pierce County is healthcare and social assistance, with 58,534 workers. The next-largest sectors are retail trade (39,203 workers) and educational services (30,055).
Sectors in Pierce County with the highest average wages per worker are utilities ($83,017) and public administration ($78,924). And the industries with the highest concentration of employment in Pierce County compared to the national average are transportation and warehousing, construction, and — you guessed it — healthcare and social assistance.
Over the next year, the county economy is expected to add 3,980 jobs. The fastest growing sector is expected to be — again — healthcare and social assistance, which is projected to have year-over-year growth of 2.1 percent.
What about Joint Base Lewis-McChord, you ask? In 2016, the Department of Defense employed 55,125 personnel in Pierce County – 40,065 of which are not counted in our employment statistics because they are active duty military. The military spent $2.4B for Pierce County personnel in 2016.
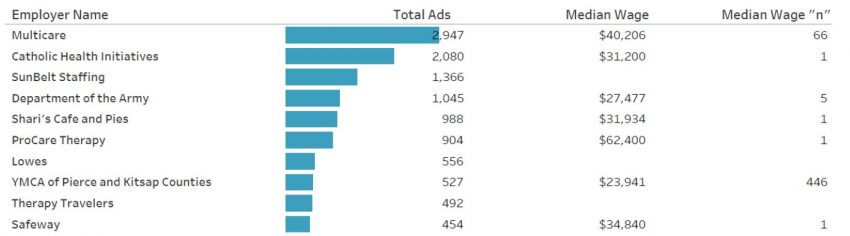
What employers posted the most job openings?
Healthcare providers led the way in job postings last year, which should come as no surprise if you’ve read the rest of these highlights. MultiCare posted the most jobs, with 2,947 ads and a median wage of $40,206. Catholic Health Initiatives came in second place with 2,080 ads and a median wage of $31,200.
Healthcare staffing agency SunBelt Staffing rounded out the top three with 1,366 job ads in 2018. No median wage information was available for the company’s job postings.
WorkForce Central strengthens the Pierce County economy by identifying skill gaps between jobseekers and employment opportunities, fostering data-driven decision making, and connecting workforce development partners into a cohesive, collaborative and effective network.
###