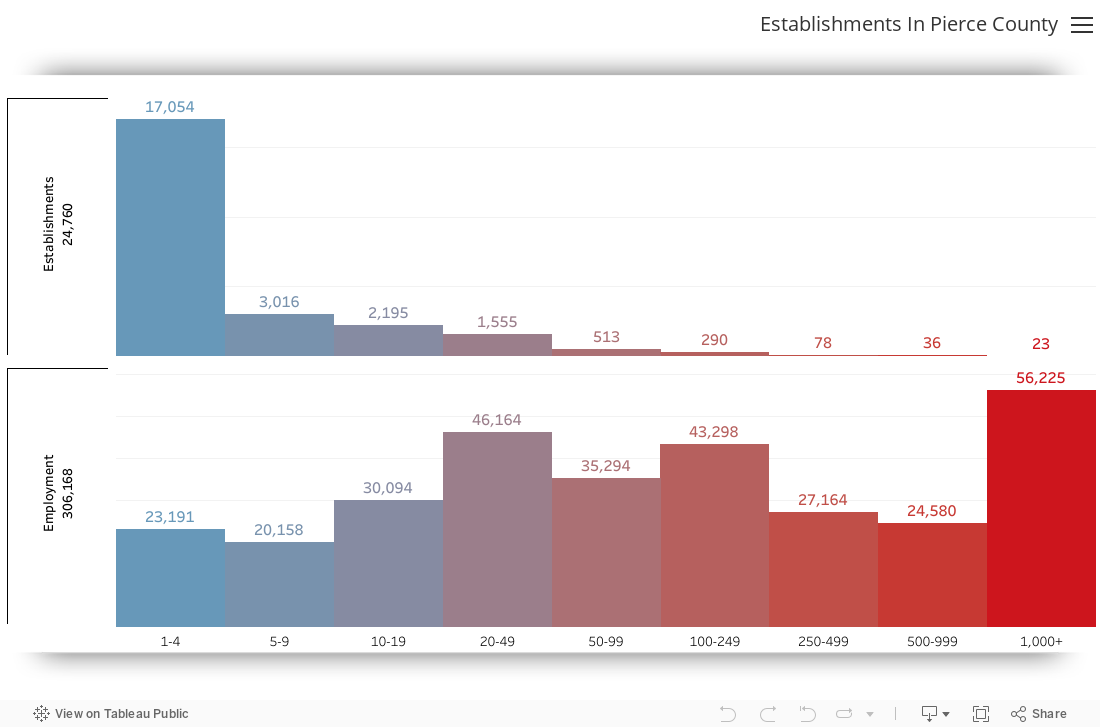
ESTABLISHMENTS DASHBOARD
In Pierce County, we have over 24,000 establishments representing over 318,000 workers. Two out of every three establishments are micro-businesses with four or fewer employees. Over half of all workers, however, are concentrated in larger establishment (>100 employees), with nearly one out of every five workers employed with the top 24 largest establishments.
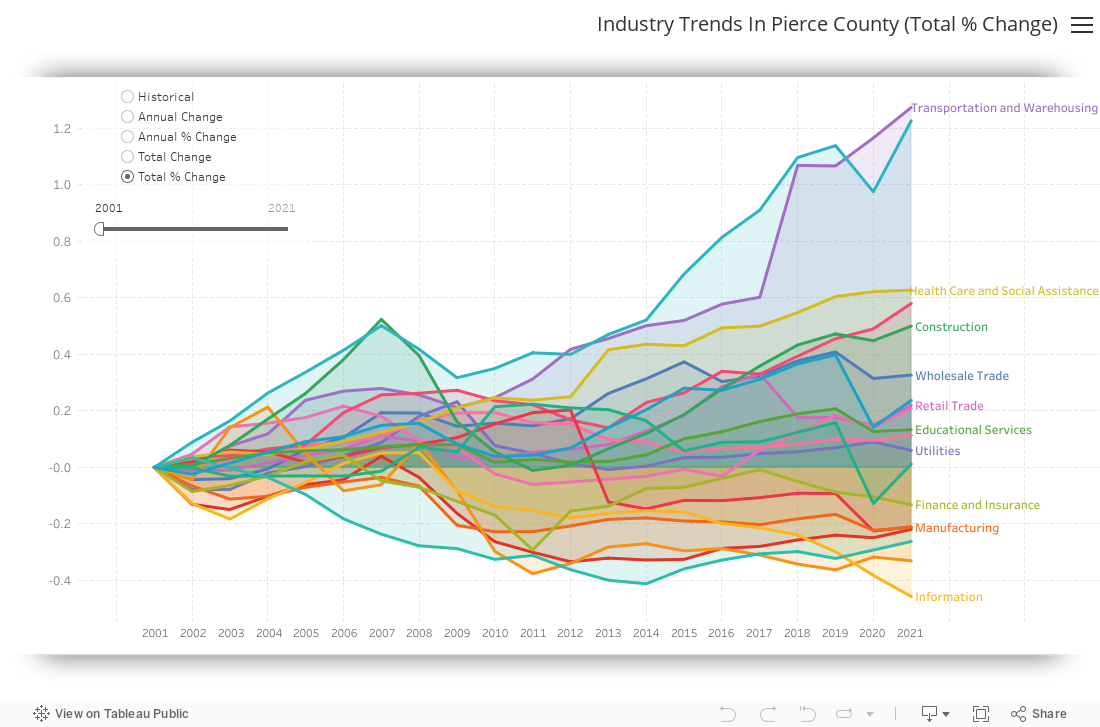
INDUSTRY TRENDS
In the Industry Trends dashboard, we see two decades of employment shifts by sector. Using the controls on the upper-left we can adjust these estimates to reflect employment trend calculations, including net difference (Annual Change) vs relative difference (Annual % Change) and well as cumulative change (Total Change) and cumulative change relative to the starting year (Total % Change).
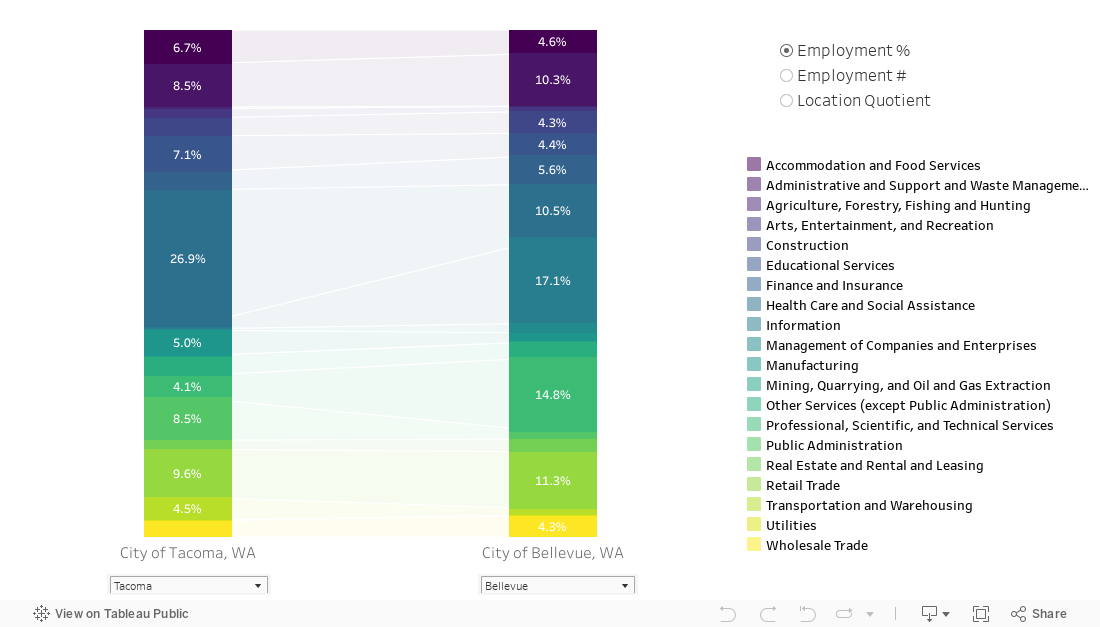
INDUSTRY COMPARISON
As a region, our economic identity is tied closely to the distribution of our workers by industry, specifically how that distribution compares to other places. In the visual below, we can see how one place in Washington compares to another, with employment grouped by industry and represented as a count, percent of total, or location quotient (the industry size relative to the national concentration).
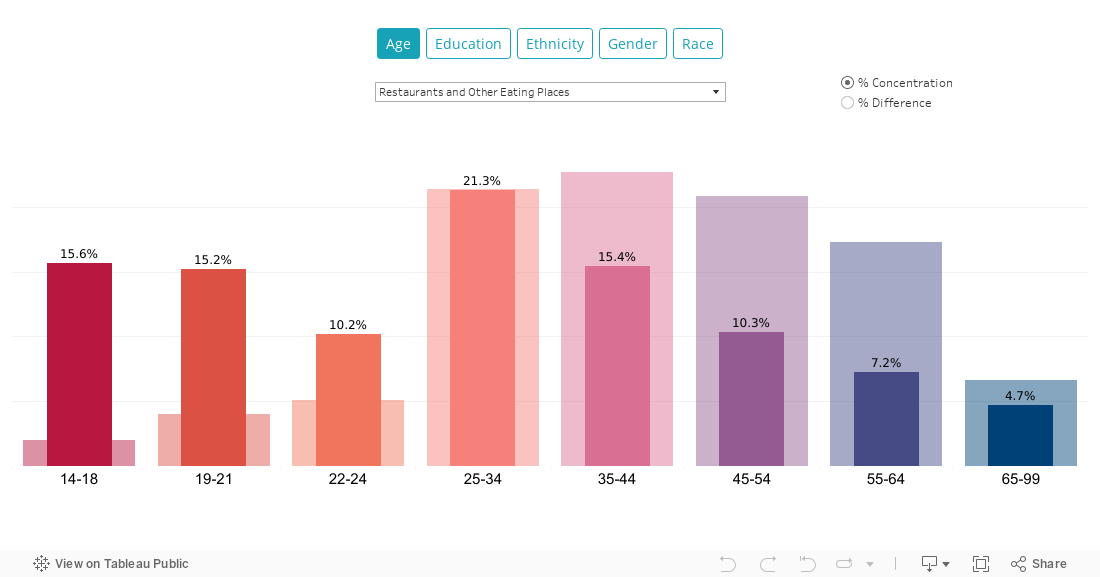
INDUSTRY DIVERSITY
Across occupations we see stark differences in the concentration of workers by demographic characteristic. This sorting of workers happens for many reasons, but the trends that lead to occupation segregation are often mirrored and, in some cases, even driven by industry-level differences. Below is a visual comparing the demographic distribution for a selected industry to the distribution for all industries. This information can be used in many ways, from identifying challenges in local industry-level representation, to indicating if an industry is at more risk of future labor shortages due to retirements.